Understand How your Fleet is Used and Where Emissions can be Reduced

Turn vehicle activity and usage data into practical insights that help identify unnecessary running time, inefficient vehicle use, and opportunities to create a more efficient fleet.

Every Journey Creates Insights

Every trip, stop, and period of vehicle activity contributes to a bigger picture of how your fleet operates. Bringing this information together can help fleet managers move beyond assumptions and better understand how vehicles are actually being used.
Green location pins connected by a dotted path inside a light green circle on a white background.

Trips

Understand journey frequency and patterns
Icon depicting a green road lane with dashed center divider and two solid outer lines inside a light green circle.

Distance

See how vehicle mileage is distributed across fleets
Green minimalist bar chart icon with three vertical bars increasing in height from left to right inside a light green circle.

Activity

Understand when and how vehicles are operating

Idle Time

Identify periods of non-productive vehicle running

Utilisation

Compare how effectively different vehicles are being used

The BIGGER Picture

Your fleet data can reveal:
Usage Patterns - when, where, and how frequently
Underutilised vehicles - identify inactive assets
Unnecessary activity - highlight excessive trips or mileage
Fleet imbalances - compare to identify uneven allocation
Changes over time - monitor the efficiency of fleet activity
Turning everyday vehicle activity into clear insights helps fleet managers make decisions based on real usage rather than assumptions

One Fleet. Different Usage Patterns.

Look beyond total fleet averages to see insights on how individual vehicles are being used, where inefficiencies may exist, and which vehicles contribute most to fuel use and emissions.

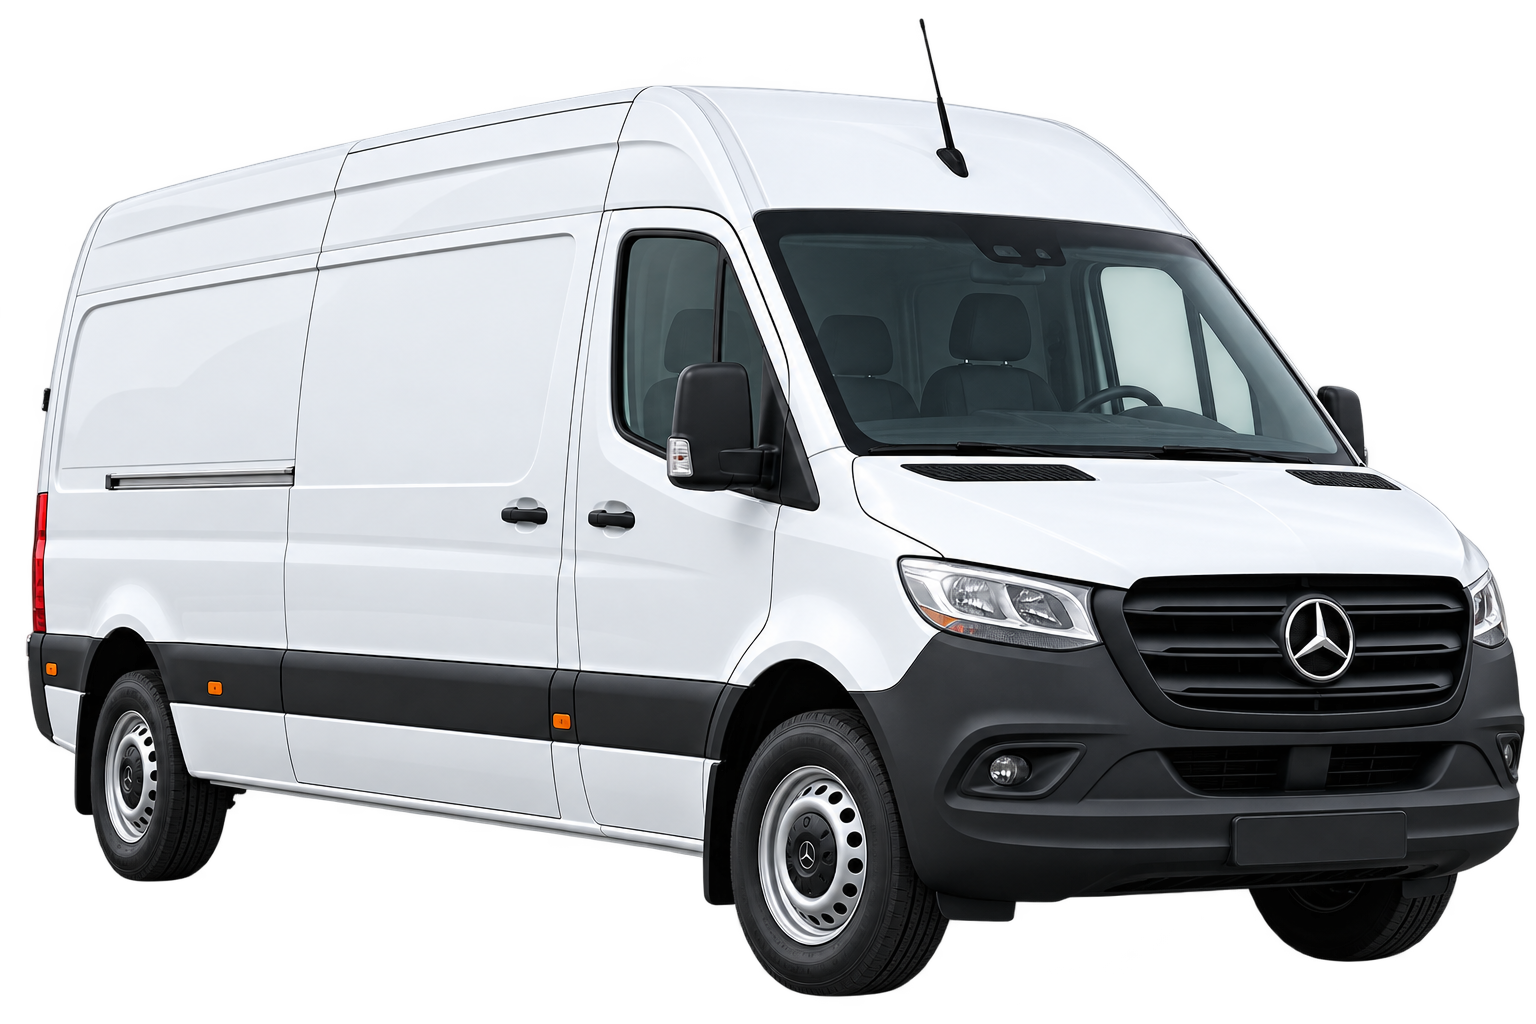
Vehicle A
High utilisation

White Mercedes-Benz Sprinter cargo van with black front grille and bumper, shown at a slight angle from the front right side.
Vehicle is actively supporting operations with regular daily activity and low idle time, increasing productivity.
Trip
Distance
Activity
‍
Idle Time

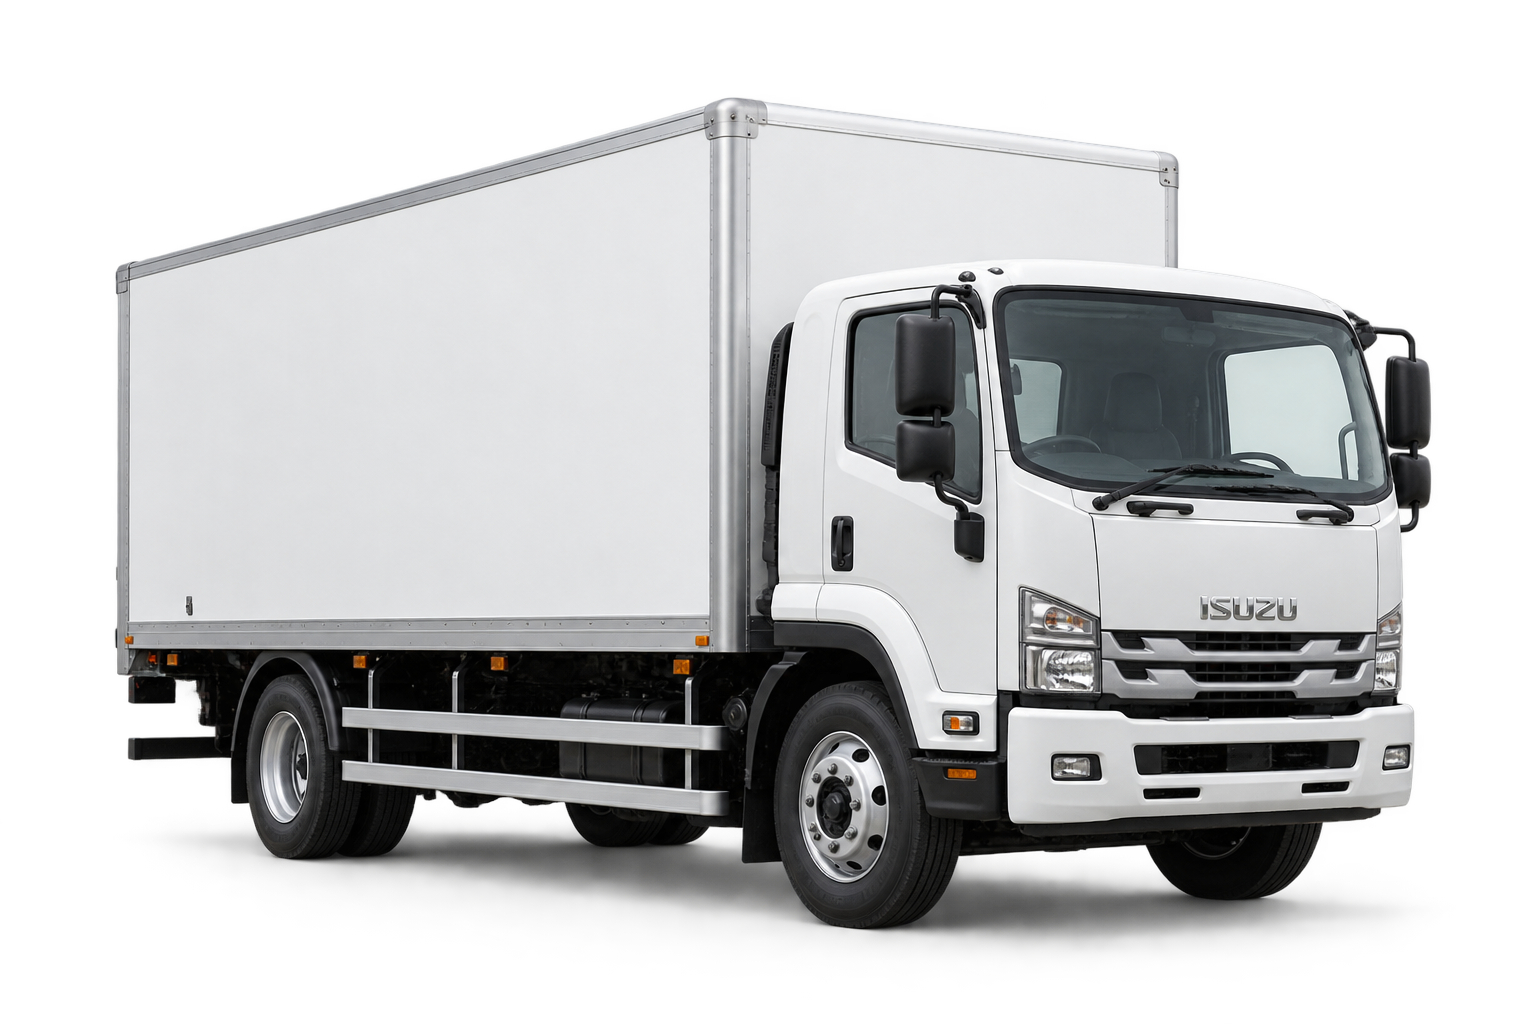
Vehicle B
High Idle Activity

White Isuzu box truck with large cargo area, shown at a three-quarter angle.
Vehicle has crucial stationary running time and significant idle times contributes to unnecessary fuel use and emissions.
Trip
Distance
Activity
‍
Idle Time

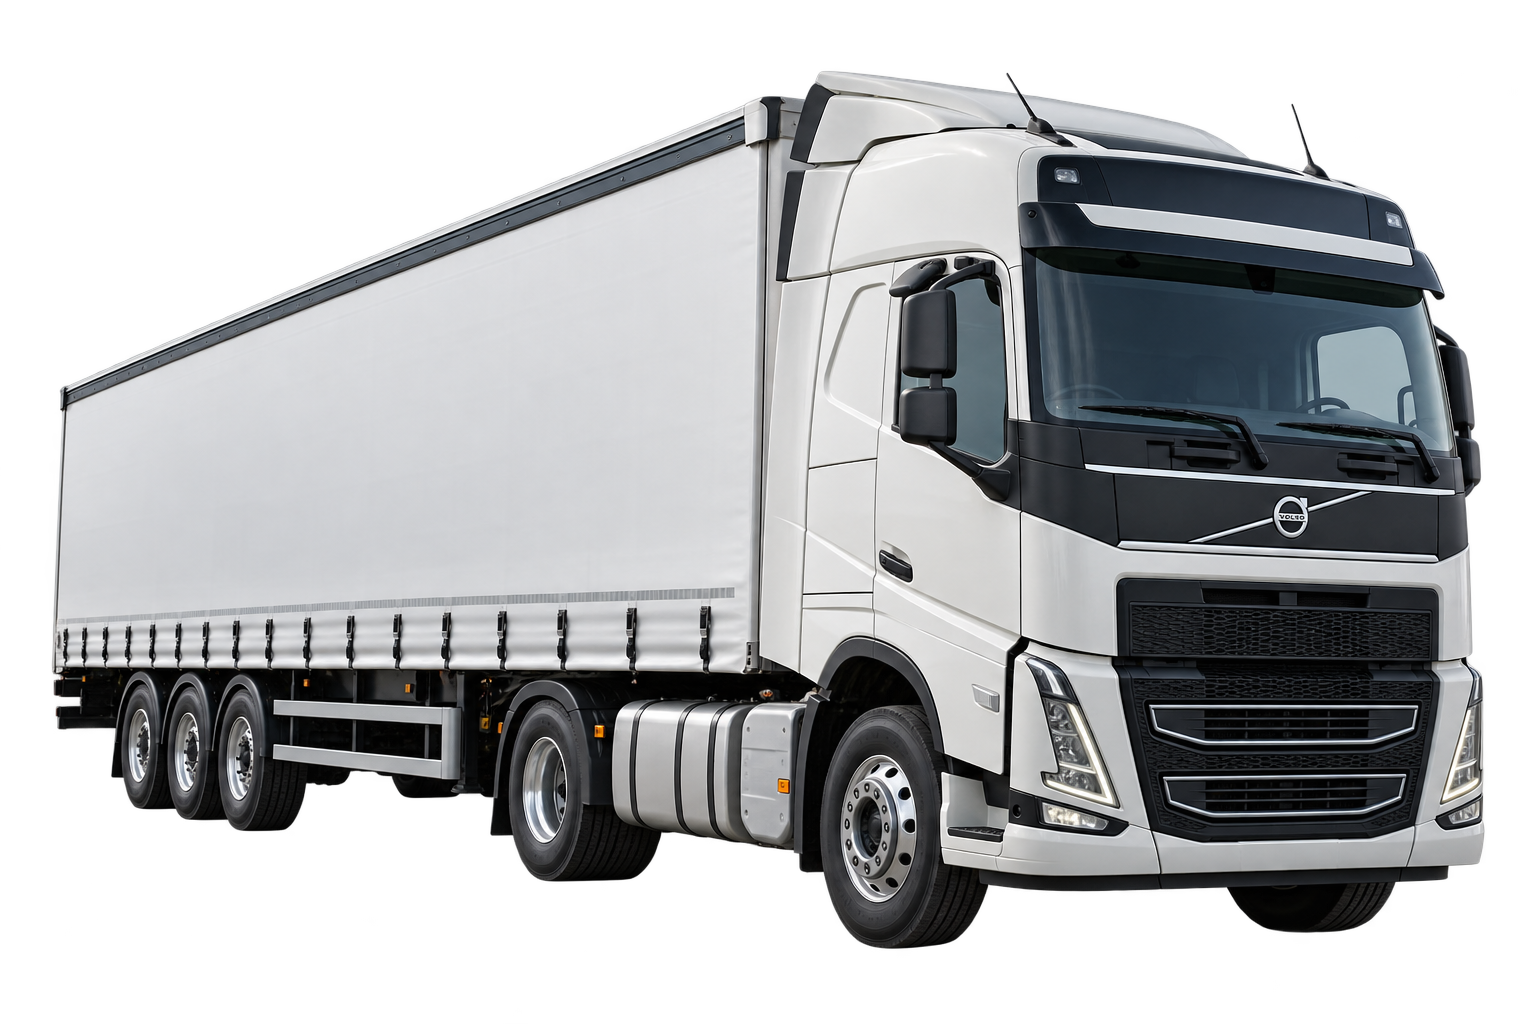
Vehicle C
Underutilised

White Volvo semi-truck with a long enclosed trailer, shown at a three-quarter front view.
Vehicle has low activity compared to other fleets and may open an opportunity to reallocate or reduce fleet size.
Trip
Distance
Activity
‍
Idle Time

From Fuel Efficiency to Lower Emissions

Reducing unnecessary fuel consumption can support more efficient operations and lower emisions. By identifying excessive idling, inefficient vehicle use, and avoidable fuel consumption, fleet operators can improve vehicle utilisation and reduce the amount of fuel required to keep operations running.
Green fuel pump nozzle with a green fuel drop above a descending bar chart, symbolizing decreasing fuel consumption or prices.

01

REDUCE UNNECESSARY FUEL USE

Identify inefficient vehicle activity and operating patterns that may contribute to unnecessary fuel consumption.
↓

02

LOWER FUEL-RELATED EMISSIONS

Reducing unnecessary fuel consumption can also help reduce associated emissions, supporting more efficient and environmentally conscious fleet operations.
Illustration of a cloud labeled CO2 with three green downward arrows beneath it, pointing toward two green leaves, symbolizing carbon dioxide absorption by plants.
↓
A digital chart window showing a downward trending line graph with four data points connected by a green line, alongside a clock icon and two green leaves in the background.

03

TRACK PROGRESS OVER TIME

Continue monitoring fleet activity to undertand how operational changes are affecting vehicle usage, fuel efficiency, and overall fleet performance.

Ready to Improve Fuel Efficiency?

Emission & Usage Insights FAQ for Vehicles

Clear answers on behaviours that will impact fuel usage, fleet monitoring, and idling.

How can fleet monitoring help reduce fuel consumption

Fleet monitoring can provide visibility into factors, such as idle time, trip activity, driving behaviour, and vehicle utilisation. This helps managers identify patterns that may contribute to unnecessary fuel use and take approriate action.

How does excessive idling affect fuel usage?

A vehicle continues to consume fuel while the engine is running, even when it is stationary. Monitoring idle activity can help businesses identify vehicles, drivers, or operational situations associated with excessive idling and ensure their productivity is maximised.

Can driving behaviour affect fuel efficiency?

Yes. Driving patterns, such as harsh acceleration, speeding, and frequent breaking, can contribute to inefficient fuel consumption. Driver activity can help fleet managers identify patterns that may require further attention or training.

How can better fuel utilisation reduce operating costs?

Insights obtained can highlight assets that are heavily used, underutilised, or spending significant periods inactive. This can support decisions are vehicle allocation, scheduling, and overall fleet requirements.

How can LogisFleet help improve fleet fuel efficiency?

LogisFleet provides visibility into vehicular activity and driving patterns, helping fleet managers identify potential sources of fuel waste, such as excessive idling, inefficient driving, unnecessary trips, and poor vehicle utilisation. These insights can support more informed operational decisions, targeted driver coaching, and better vehicle allocation to improve overall fleet efficiency.