Turn Fleet Activity Into Operational Insight

Bring vehicle activity, trip data, and fleet performnace information into a clearer operational view. LogisFleet helps fleet managers identify patterns, compare performance and make informed decisions.
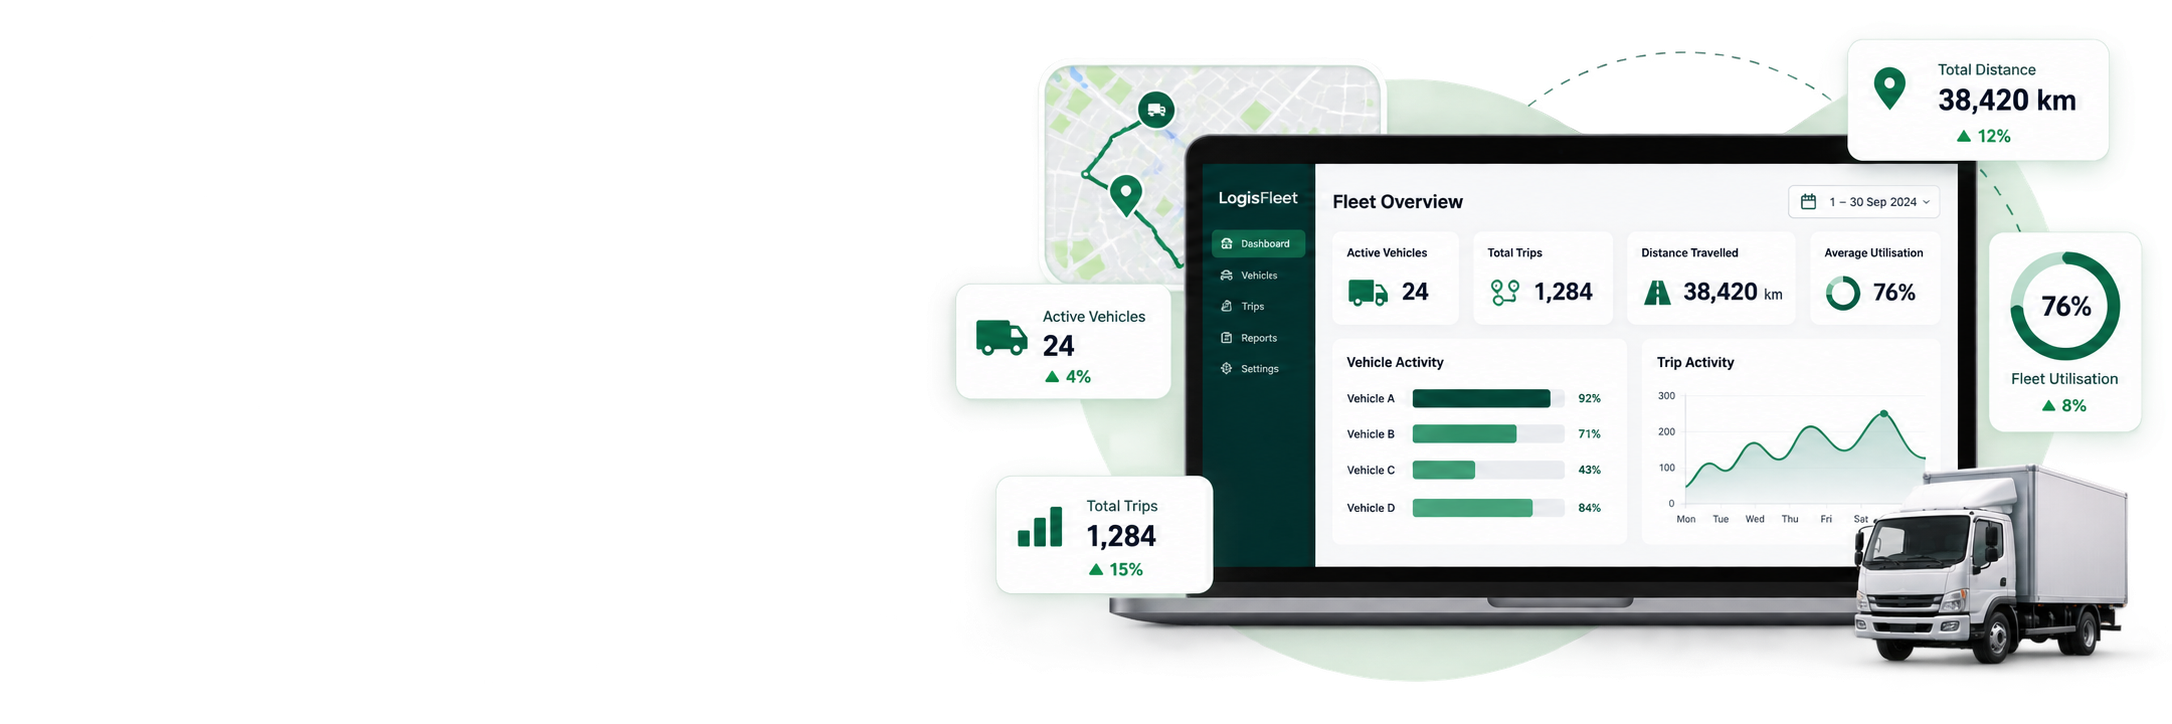
Your Fleet Generates Data Every Day.

Every trip, stop, and vehicle movement creates operational information. When that information is fragmented or difficult to interpret, identifying inefficiencies and understanding fleet performance becomes more difficult.

Vehicle Activity

Dashboard overview of fleet management showing 24 active vehicles, 1,284 total trips, 38,420 km distance traveled, and 76% average fleet utilization, with various charts and a delivery truck image.

Understand when and how fleet vehicles are being used across daily operations

Trip & Distance Data

Review journey activity, distance travelled, and movement patterns across vehicles
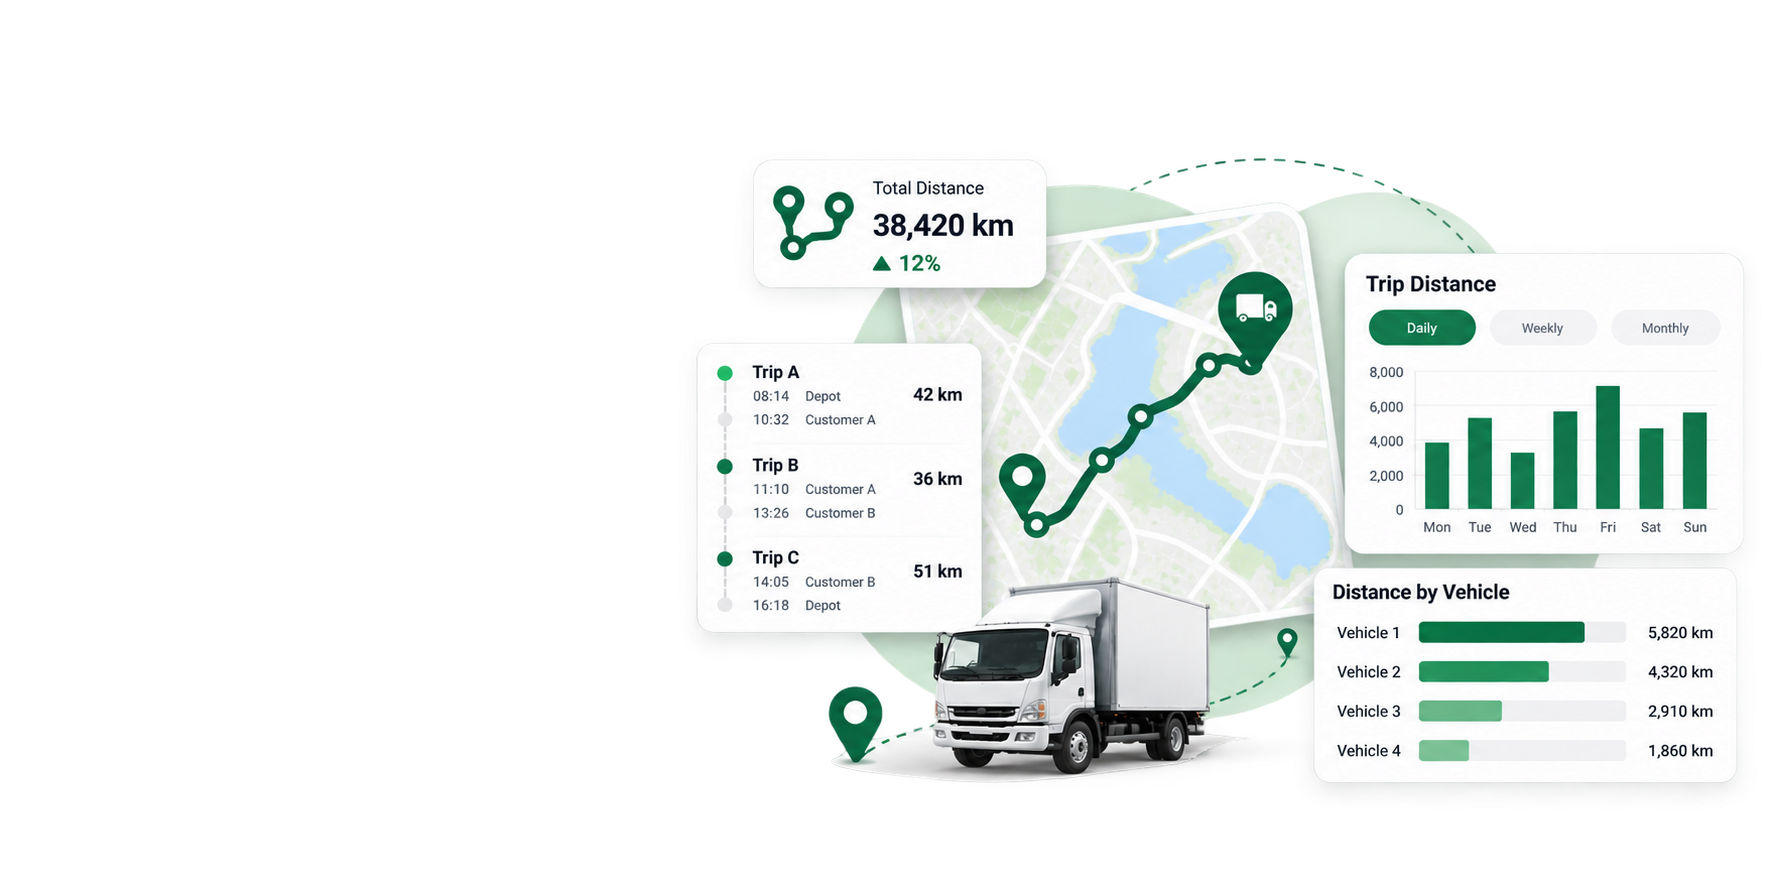
Logistics dashboard illustration showing a truck with a route map, total distance of 38,420 km with a 12% increase, trip details for Trips A, B, and C with distances, a bar chart of daily trip distances from Monday to Sunday, and a bar chart of distance by four vehicles.

Idle & Stop Activity

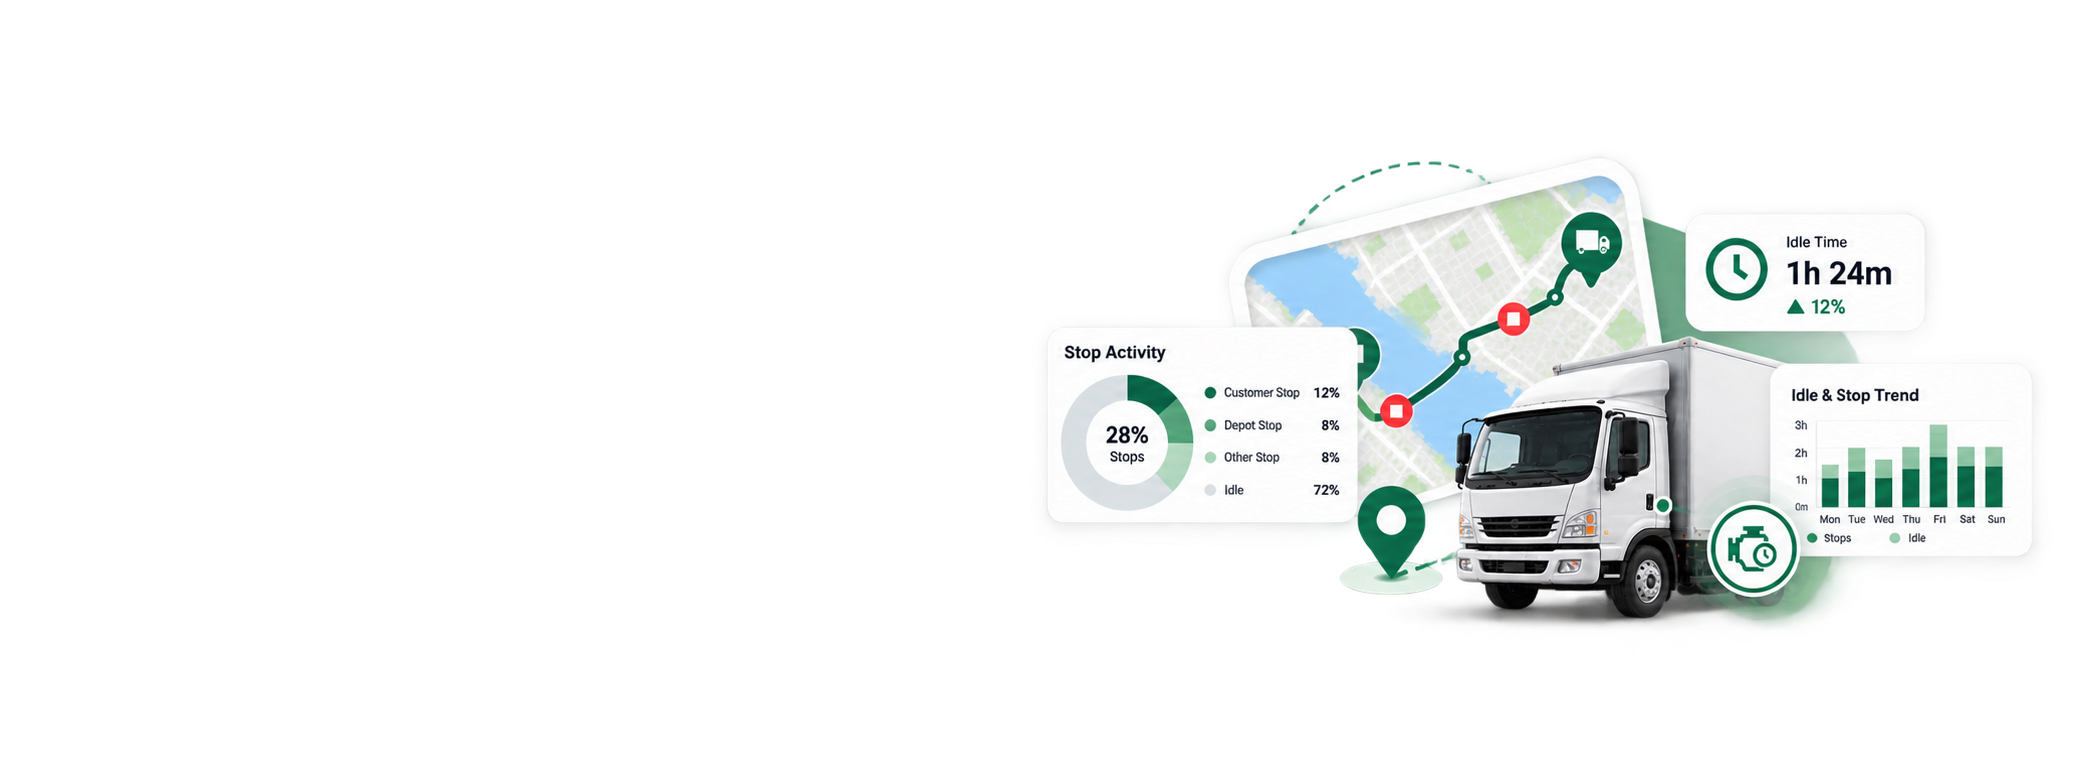
Illustration showing a delivery truck with route tracking on a map behind it, accompanied by data charts depicting stop activity, idle time of 1 hour 24 minutes with a 12% increase, and idle and stop trends over six days.

Identify periods of stationary activity and patterns that may require further review
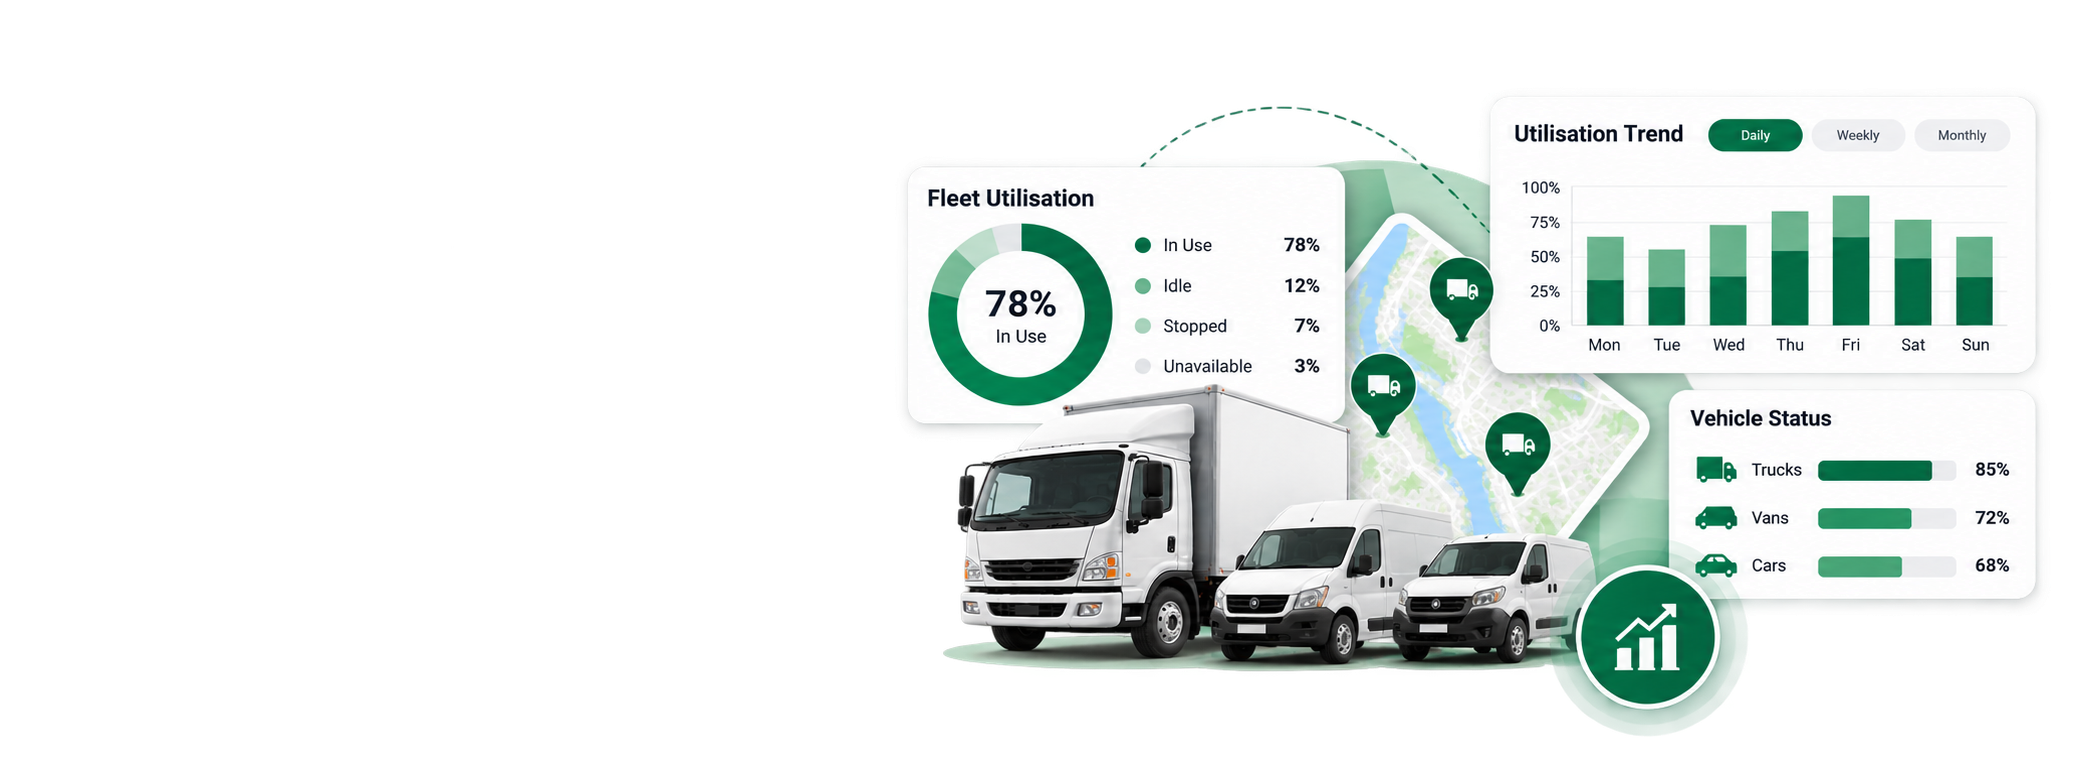
Fleet Utilisation

Dashboard showing fleet utilisation data with a circular chart indicating 78% in use, 12% idle, 7% stopped, and 3% unavailable. A bar graph displays daily utilisation trends from Monday to Sunday, with the highest usage on Sunday. Vehicle status bars show trucks at 85%, vans at 72%, and cars at 68%. Images of three vehicles, including a large truck and two vans, are displayed in front of maps with vehicle location markers.

Compare vehicle activity to understand how effectively fleet assets are being used
From Data to Better Fleet Decisions

Turn everyday fleet data into clearer operational insights. Monitor activity, identify patterns, compare performance and use insights to support more informed fleet decisions.
Green circular icon featuring a clipboard with a truck illustration, a checklist with three checkmarks, and a magnifying glass overlay.

01 - MONITOR

Capture relevant vehicle, trip, and operational activity acoss the fleet.
Icon showing a truck inside a large gear connected by lines to three smaller circles containing a wrench, a list, and a smaller gear, representing truck maintenance and management.

02 - ANALYSE

Bring fleet information together to identify patterns, differences, and areas requiring assitance.
Green-themed icon showing a delivery truck in front of a clipboard with checklist and a large checkmark symbol, representing completed delivery or logistics tasks.

03 - COMPARE

Compare vehicles, activity, and operational periods to develop a clearer picture of fleet performance.
Green circular icon featuring a checklist with four check marks connected to four types of vehicles: a small van, a medium truck, a large semi-truck, and a bus, alongside a stack of files with a large check mark, symbolizing vehicle inspection or fleet management.

04 - IMPROVE

Use operationa insights to support decision and vehicle allocation, utilisation, and day-to-day fleet mamnagement,

Compare Performance Across Your Operations

Analyse vehicle activity, routes, and operational data to identify differences, track changes over time, and uncover broader patterns across your fleet.
Dark green delivery or cargo truck icon inside a light green circular background.

By Vehicle

Compare activity across individual vehicles to identify differences in usage and operating patterns.

Dark green calendar icon with six square date blocks inside a light green circular background.

By Time Period

Review changes across days, weeks or reporting periods to understand how fleet activity develops over time.
Stylized green icon of three vehicles—a truck in the center flanked by two cars—inside a light green circular background.

Across the Fleet

Move beyond individual vehicle data to identify broader operational patterns across the fleet.
Performance Comparison

VEHICLE
TRIPS
DISTANCE
UTILISATION
Vehicle A
142
4,820 km
91%
Vehicle B
118
3,940 km
74%
Vehicle C
61
1,970 km
42%

Better Visibility. Better Operational Decisions

Turn fleet activity into clear, actionable insights that help you understand performance, identify inefficiencies, and make more informed operational decisions.
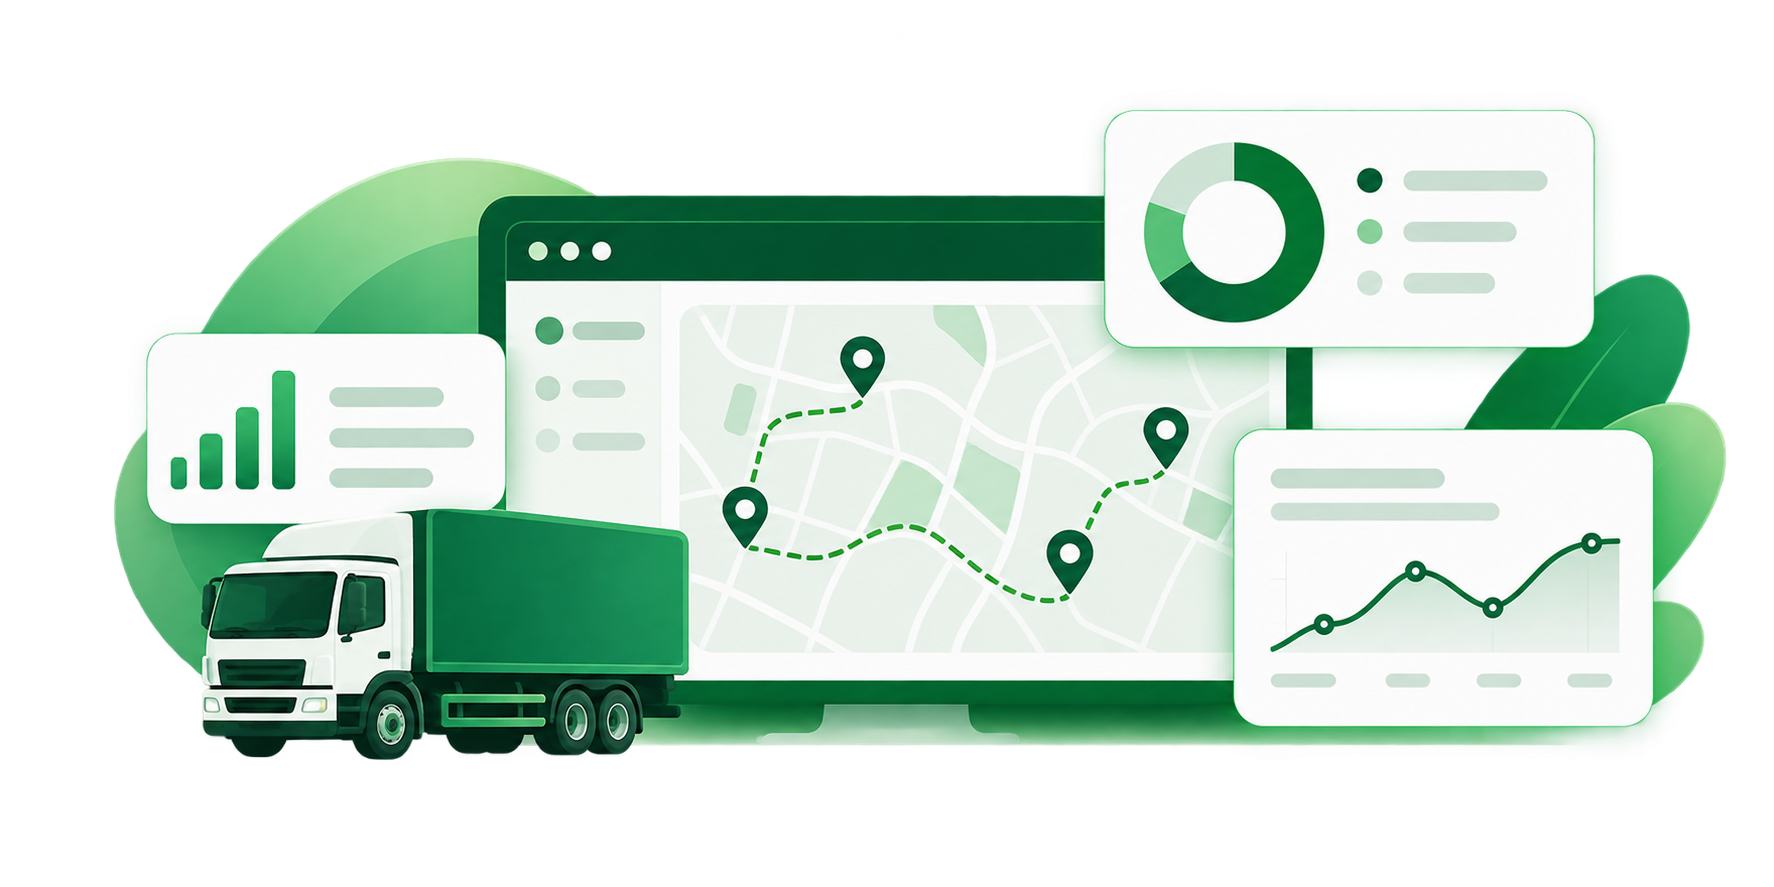
Illustration of a green delivery truck beside a computer screen showing a map with multiple route points connected by dashed lines, surrounded by graphical charts including a bar graph, a pie chart, and a line graph, representing logistics and route planning.

Improve Fleet Visibility

Bring vehicle activity, trip information, and utilisation data together to create a clearer view of day-to-day fleet operations. This helps fleet managers understand how vehicles are being used and where operational attention may be required.

Identify Inefficiencies

Analyse activity patterns and compare vehicles to identify potential inefficiencies such as excessive idling, underutilisation, or unusual operating patterns. These insights can help managers make informed decisions about vehicle allocation, scheduling and whether fleet resources are being used effectively.
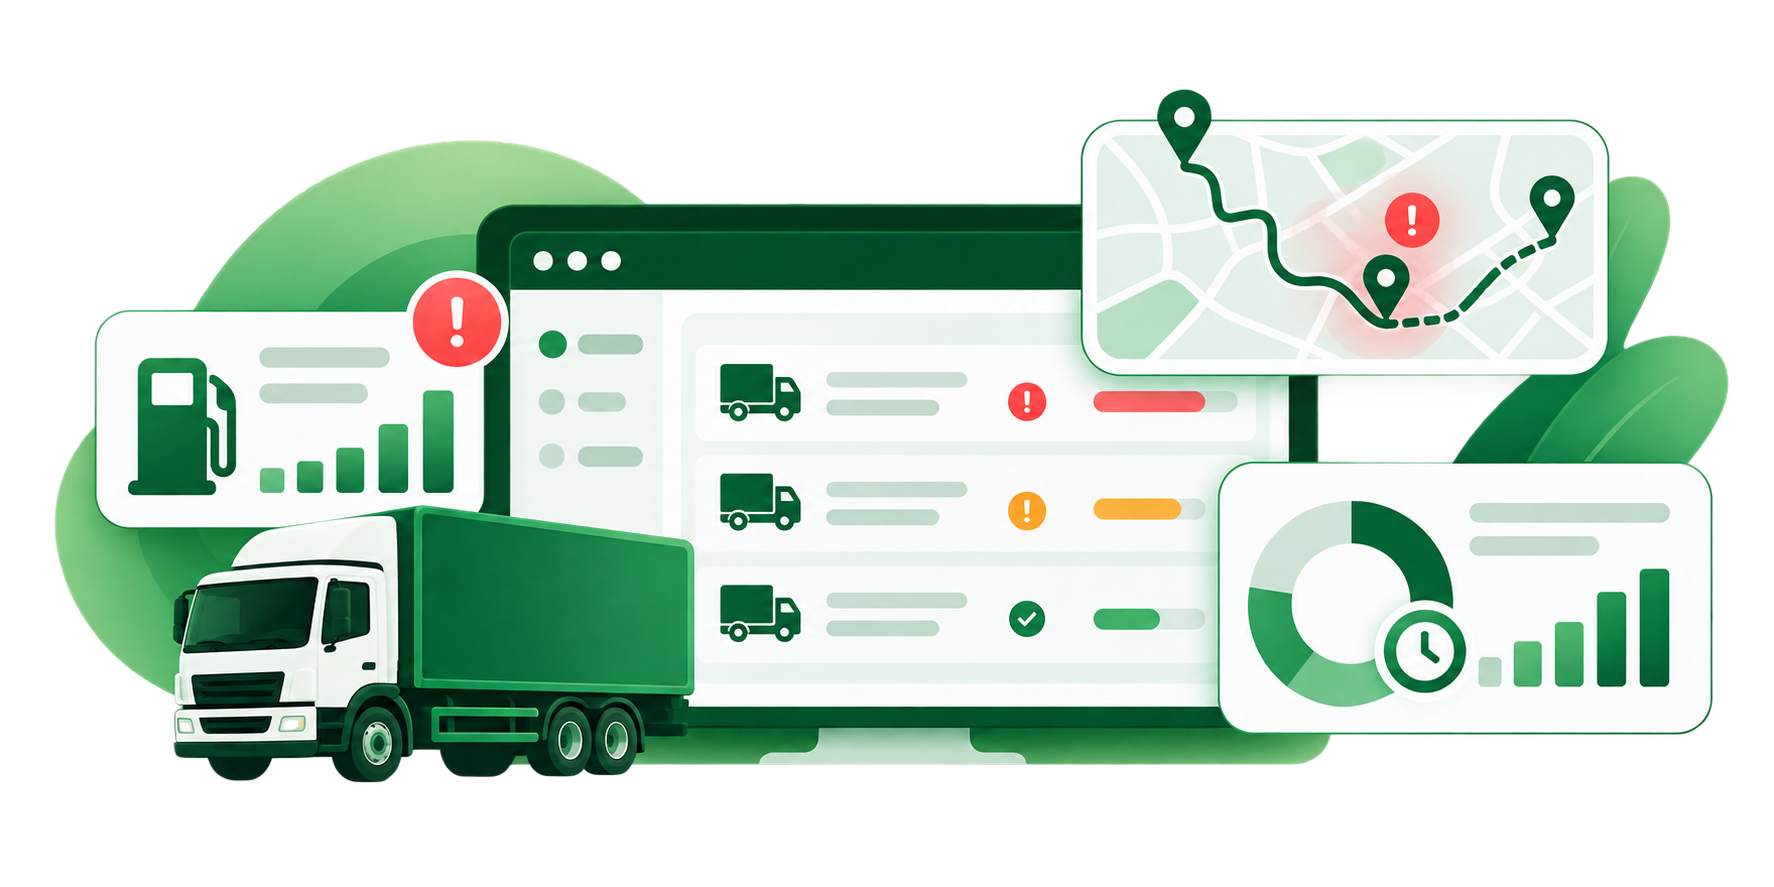
Illustration of a green truck in front of a computer monitor displaying a logistics dashboard with delivery trucks and status indicators, a fuel consumption chart with an alert, a route map showing a warning point, and a circular progress and bar chart representing performance metrics.
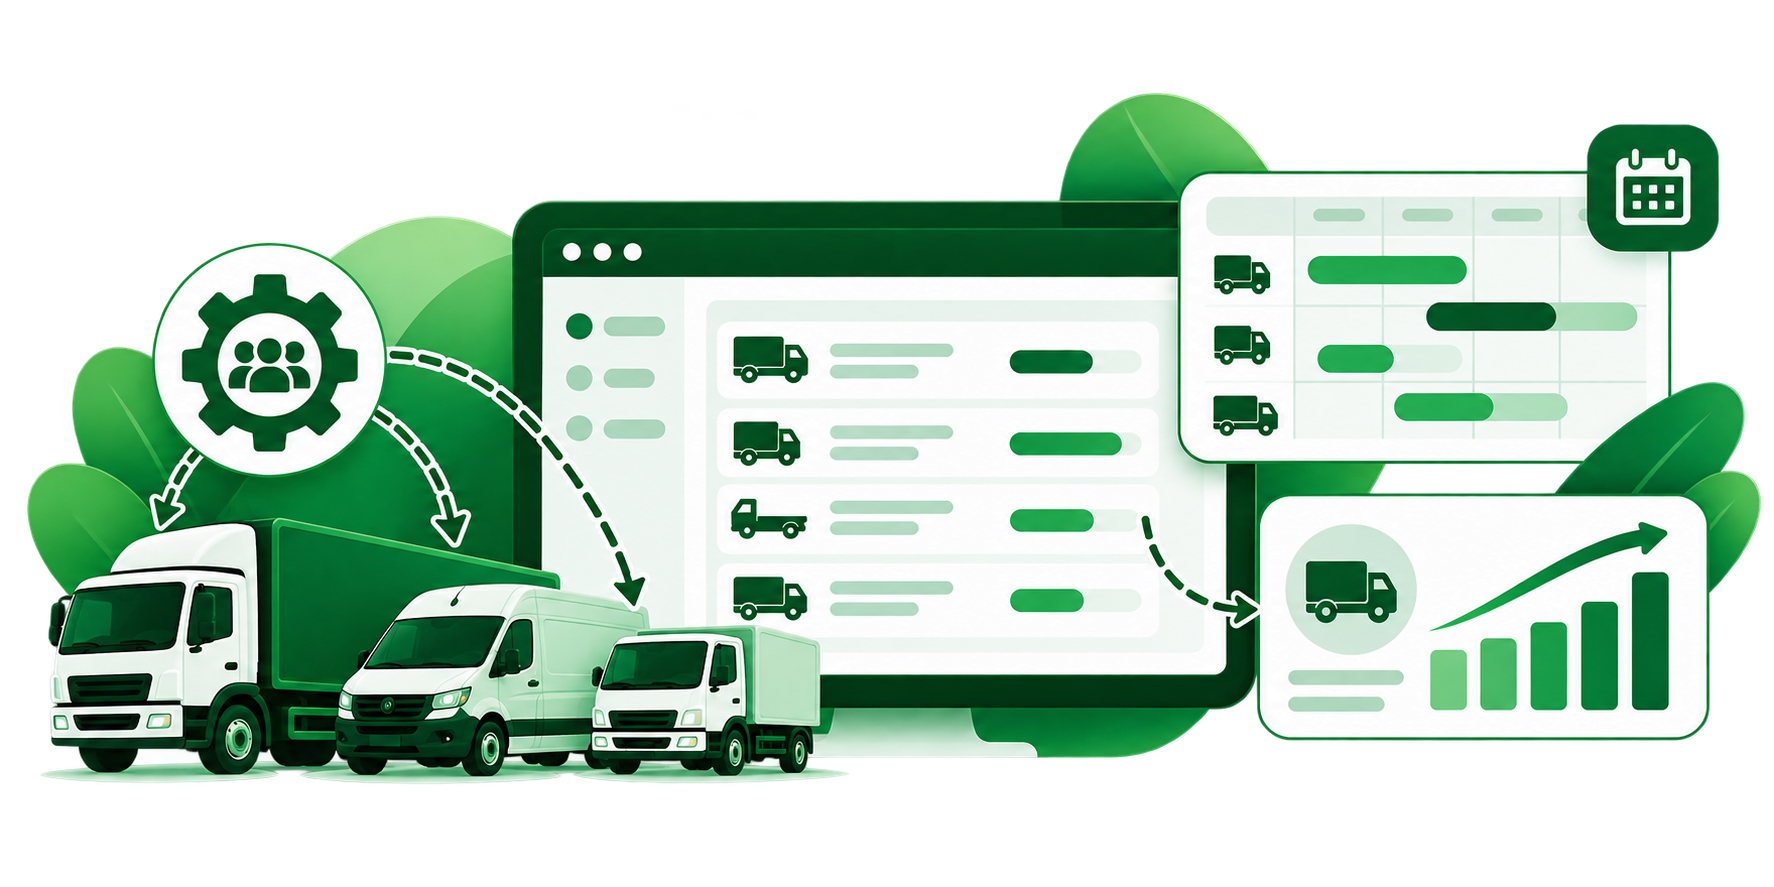
Graphic showing three delivery trucks in front of a computer screen displaying a delivery schedule and progress bars, with arrows indicating workflow from team management to scheduling and improved delivery performance.

Support Better Resource Allocation

Understand how frequently and effectively individual vehicles are being used across the fleet. Comparing utilisation can support more informed decisions about vehicle allocation, scheduling, and whether fleet resources are being used effectively.

Track Performance Over Time

Use historical fleet information to compare activity across days, weeks, or reporting periods and understand how operational performance changes over time. This provides greater context for evaluating trends and monitoring the impact of operational changes.
Illustration of three green and white delivery trucks in front of a large computer screen displaying an upward trending line graph from January to June, accompanied by icons of a calendar, clock, and bar charts representing logistics and delivery performance data.

Ready to Get More From Your Fleet Data?

FAQ - Operational Analytics & Reporting

What is fleet operational analysis?

Fleet operational analysis involves analysing vehicles and trip data to better understand how a fleet is being made. It can help managers identify activity patterns, compare vehicle performance and make more informed operational choices.

What information can be analysed across a fleet?

Depending on the available fleet data, businesses can reiew information such as vehicle activity, trips, distance travelled, stop activity, idle time, and vehicle utilisation. Bringing these data points together provides a clearer view of day-to-day fleet operations.

How can operational analytics help reduce unnecessary idling?

Idle and stop activity data can show when and where vehicles spend extended periods stationary while operating. Identifying recurring idle patterns can help managers investigate the causes and consider changes to driver behaviour, scheduling, or operational processes where appropriate.

How does historical fleet reporting support decision-making?

Historical reporting allows businesses to compare current fleet activity with previous periods rather than relying on a single point in time. This can help identify longer-term trends, assess changes in vehicle usage and understand how operational patterns develop over time.

Can fleet analytics help with route and trip analysis?

Yes. Trip, distance, and vehicle movement data can provide greater visibility into how vehicles move throughout daily operations. Reviewing this information can help businesses identify recurring journey patterns, unnecessary travel or areas that may warrant future operational review.